Semiconductor capacity utilization (the ratio of production to capacity) appears to be on the rise, based on available data. Reliable global industry capacity data has not been available since Semiconductor Industry Capacity Statistics (SICAS) disbanded in 2011.
TSMC and UMC (the two largest pure-play foundries according to IC Insights) provide wafer shipments and wafer capacity data each quarter. Utilization is calculated by dividing the total wafer shipments by the total capacity of the two companies. This may not correspond exactly to capacity utilization due to definition and timing differences. Utilization calculated using this data exceeds 100% in some quarters. However it provides a reasonable indication of foundry utilization trends.
The U.S. Federal Reserve publishes data on capacity utilization for factories located in the U.S., regardless of the country of ownership. The names and number of companies participating in the Federal Reserve data for “Semiconductors and Related Equipment” is not available. We can assume the Federal Reserve data is a reasonable representation of U.S. semiconductor utilization.
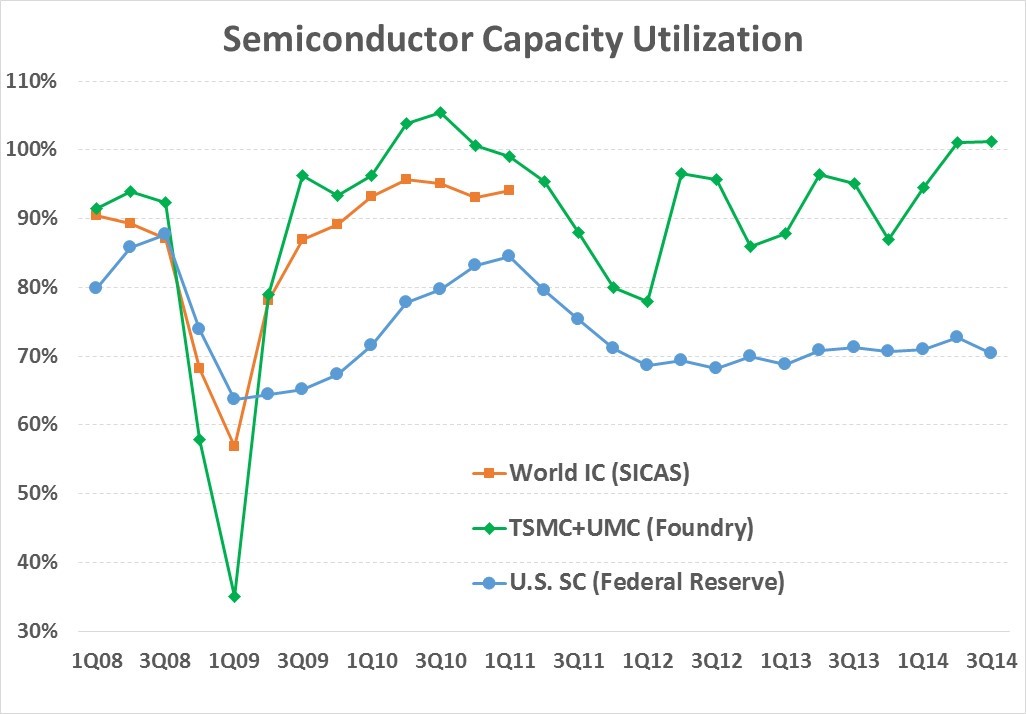
TSMC + UMC utilization hit a low of 35% in 1Q 2009 during the economic downturn but quickly rebounded to over 100% in 2Q 2010. Utilization slipped below 80% in 4Q 2011, but has recovered to over 100% for 2Q and 3Q 2014. U.S. utilization (based on the Federal Reserve data) hit a low of 64% in 1Q 2009 and recovered to 84% in 1Q 2011. Utilization dropped below 70% in 1Q 2012 and has been close to 70% since. So what is the overall industry trend? It is a reasonable assumption the answer lies between the TSMC + UMC and Federal Reserve data. Thus global semiconductor capacity utilization peaked at over 90% in 1Q 2011 (the last complete SICAS data), slid to 70% to 80% in 2012, and recovered to over 80% in 2014. This level of utilization implies sufficient capacity to meet near term increases in demand but high enough utilization to ensure profitable operations for semiconductor manufacturers.
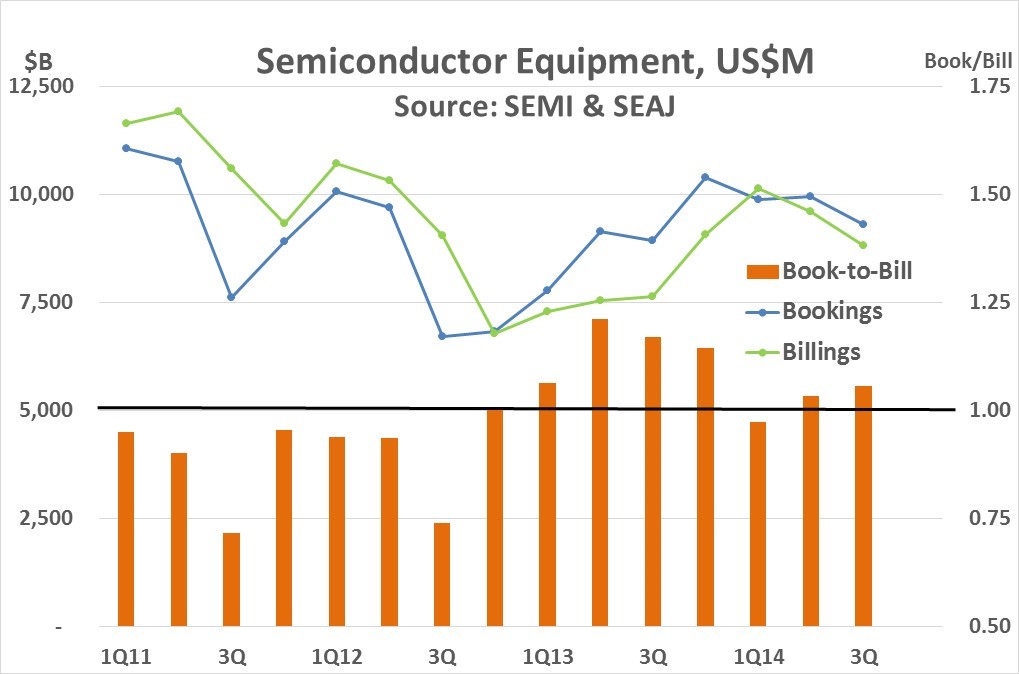
The capacity utilization trend is reflected in bookings (orders) and billings (shipments) of semiconductor manufacturing equipment. SEMI and SEAJ data shows a downtrend from early 2011 to late 2012. Bookings and billings began to increase in 2013 as capacity utilization improved. Bookings and billings in 3Q 2014 are down slightly from their peaks in 4Q 2013 and 1Q 2014 respectively, but the book-to-bill ratio has been above 1.0 for the last two quarters, indicating near term growth in semiconductor equipment.
Semiconductor Market Forecast Update
Our September forecast at Semiconductor Intelligence was for 10% growth in the global semiconductor market in 2014 and 11% in 2015. Based on WSTS data through October, 2014 growth will certainly be somewhere between 9% and 11%. We are maintaining our September numbers in our December update. Our preliminary projection for 2016 is 7% growth. The table below shows the Semiconductor Intelligence (SC IQ) numbers compared to other recent forecasts.
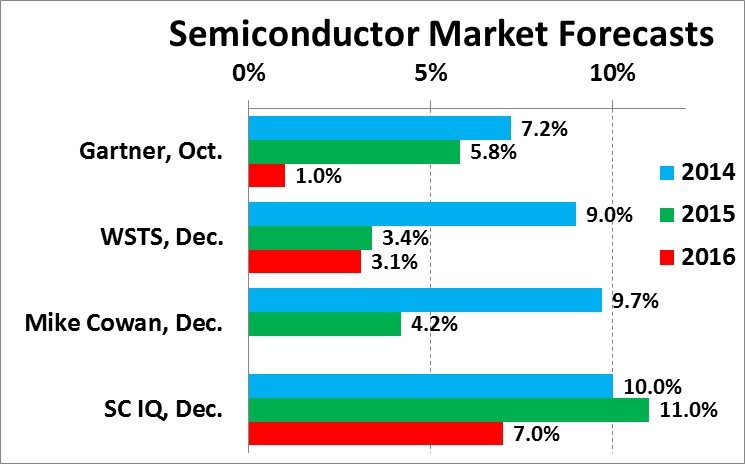
In October, Gartner projected 7.2% semiconductor market growth in 2014, slowing to 5.8% in 2015 and 1.0% in 2016. The December WSTS forecast shows a similar pattern: 9.0% in 2014, 3.4% in 2015 and 3.1% in 2016. Mike Cowan’s December update of his forecast model has 9.7% growth in 2014 and 4.2% in 2015. We at Semiconductor Intelligence have a different scenario. We expect 2015 to be slightly stronger than 2014 based on improving global economic conditions. We see a moderation of growth in 2016, but still project a healthy 7% rate.