Semiconductor manufacturers are expanding capital spending in 2021 and beyond to help alleviate shortages. In addition, many governments around the world are proposing funding to support semiconductor manufacturing in their countries.
o The United States Senate this month approved a bill which includes $52 billion to fund semiconductor research, design, and manufacturing. The bill has support in the U.S. House and from President Biden.
o The Japan Ministry of Economy, Trade and Industry earlier this month announced a “national project” to support semiconductor manufacturing in Japan.
o South Korea announced in May a plan to spend $450 billion over the next ten years on non-memory semiconductor manufacturing paid for by private business and government tax credits.
o The European Union in May announced it is ready to commit “significant” funds to expand semiconductor manufacturing in Europe.
These government initiatives will help support investment by semiconductor manufacturers. SEMI’s latest fab forecast predicts the industry will break ground on 19 new high-volume semiconductor fabs in 2021 and 10 in 2022. Equipment spending on these fabs should exceed $140 billion. China and Taiwan will each account for 8 new fabs, with 6 in the Americas, 3 in Europe and the Mideast and 2 each in Japan and South Korea.
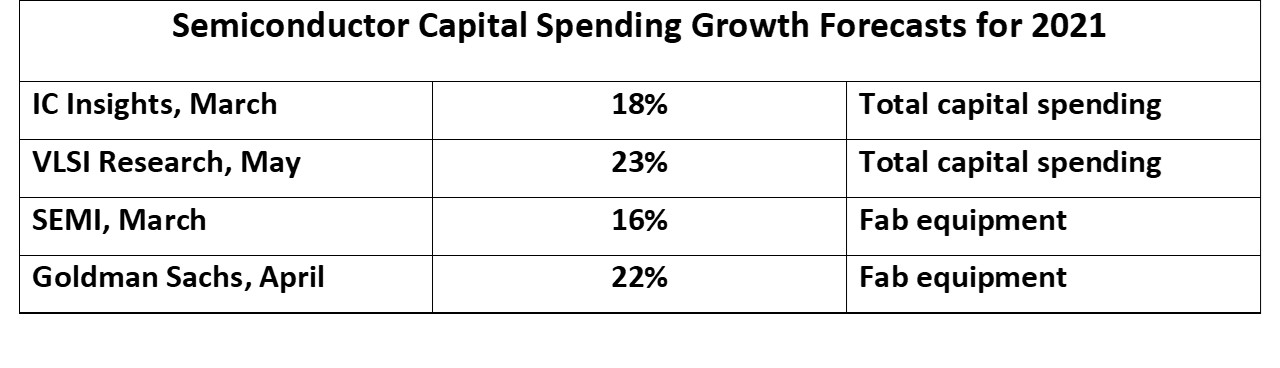
Semiconductor industry capital expenditures (CapEx) totaled $113 billion in 2020, according to IC Insights. Projections for 2021 growth range from 16% to 23%.
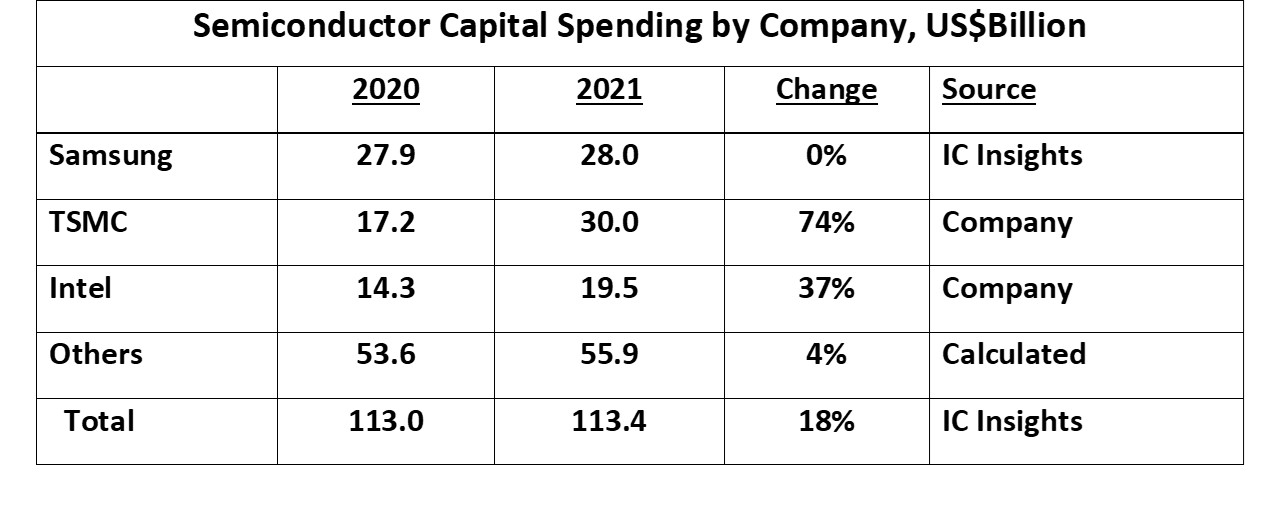
 Three companies accounted for over 50% of semiconductor capital spending in 2020. Samsung, the largest spender in 2020 at $27.9 billion, is expected to keep spending flat in 2021. TSMC will have the largest increase, adding $12.8 billion from 2020 to reach $30 billion in 2021, a 74% increase. TSMC will account for over 60% of the total industry spending increase of $20.4 billion. Intel has stated it will increase spending from $14.3 billion in 2020 to $19.5 billion in 2021, up 37%. The 2021 projections were mostly made in April after first quarter earnings release. Many of these numbers will likely be revised upward over the course of 2021.
 The semiconductor industry has traditionally experienced boom-bust cycles. Large investments are made to expand capacity during high demand periods. When demand growth slows or declines, over-capacity leads to declining revenue. This trend is illustrated in the graph below. Annual change in semiconductor capital expenditures is depicted by the green bars on the left axis scale. Annual change in the semiconductor market is shown by the blue line on the right axis scale. The red line labeled “CapEx Danger Line” indicates where an increase in CapEx over 40% leads to trouble for the semiconductor market.
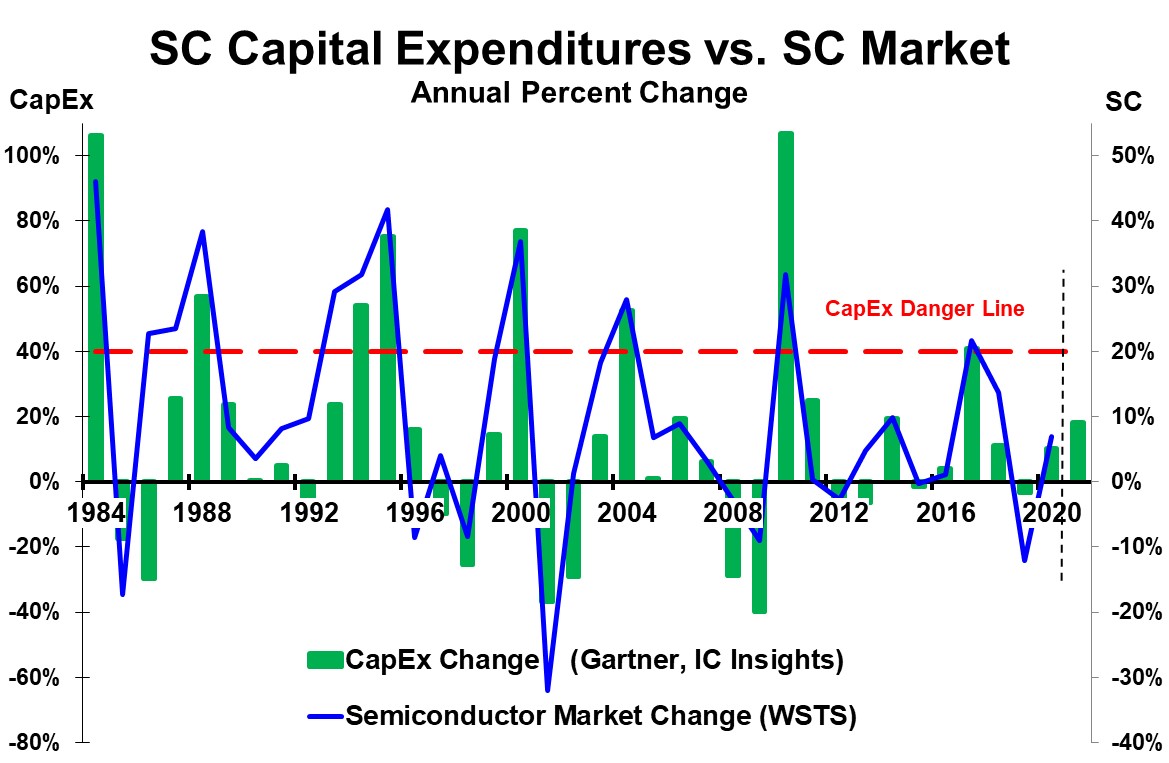
Large increases in semiconductor capital spending are followed in one to two years by a decline (or significant growth deceleration) in the semiconductor market. When the semiconductor market grew 46% in 1984, CapEx increased 106%. This was followed by a 17% decline in the semiconductor market in 1985. In 1988 the semiconductor market grew 38% and CapEx grew 57%. Following this, the semiconductor market decelerated by 30 points to 8% growth in 1989. The next big growth period was in 1993 to 1995, peaking at in 1995 at 42% market growth and 75% CapEx growth. The next year the market declined 9%. An 8% market decline in 1998 was due to the Asian financial crisis.
The semiconductor market expanded by 37% in 2000 at the peak of the internet boom. This was accompanied by a 77% increase in CapEx. In 2001, the market had its largest decline in history at 32%. In 2004 a 28% market increase and 52% CapEx increase was followed by a 21-point deceleration to 7% growth in 2005. Semiconductor market declines in 2008 and 2009 were driven by the global financial crisis. Strong growth returned in 2010 with 32% market growth and 107% CapEx growth. The market decelerated by over 30 points in 2011 to almost zero growth followed by a 3% decline in 2012. In 2017 the market increased 22% and Capex increased 41%. 2017 growth was relatively modest compared to prior peak growth rates. However, two years later in 2019 the market declined by 12%.
There are numerous factors affecting the semiconductor market growth rate including the overall economy and demand for key electronics products. However, large increases in capacity have invariably led to overcapacity when demand slows. The overcapacity leads to semiconductor price declines, especially for commodity products such as memory. Inventories held by electronics manufacturers and distributors are cut. This overcapacity tends to occur following CapEx increases of over 40%. This is indicated by the red CapEx danger line in the graph.
With forecasts of 2021 CapEx growth in the range of 16% to 23%, the industry is nowhere close to the “danger line” of over 40% growth. Even if CapEx growth accelerates in the second half of 2021, it is not likely to exceed 30%. TMSC is comfortable with a 74% CapEx increase since it has numerous foundry customers clamoring for more capacity. Two other foundries, UMC and GlobalFoundries, each plan to at least double CapEx in 2021 versus 2020. Foundry company SMIC of China plans to cut CapEx 25% in 2021 primarily due to trade issues. The memory companies such as Samsung are cautious on CapEx after seeing a 33% decline in the memory market two years ago in 2019.
While the current situation does not portend excessive semiconductor capacity in the near term, it bears watching in the next couple of years. It remains to be seen how much of the current semiconductor shortage is due to short-term disruptions from the pandemic and how much is due to increasing demand for electronic equipment and increasing semiconductor content.